Original source publication: de Moura, F. L. and F. de Sá-Soares (2021). A Network Analysis of IT-CMF. Proceedings of the 14th IADIS International Conference on Information Systems 2021—IADIS IS 2021, Virtual Conference 77–88. IADIS Press, ISBN: 978-989-8704-27-6.
The final publication is available here.
A Network Analysis of IT-CMF
Centro ALGORITMI—University of Minho—Guimarães, Braga, Portugal
Abstract
Information Systems and Technology (IST) have been a great support in meeting business challenges, providing organizational agents with information to better perform their tasks. However, IST also requires attention to ensure that they continue to be valuable to all areas of the enterprise. In order to help organizations get value from IST several management models have emerged. IT-CMF is a comprehensive reference to guide the evolution in 36 different areas of the organization, in terms of its relationship with IST. The adoption of IT-CMF requires managers to decide on the areas to be enhanced, in order to make better use of organizational resources to add value to the organization’s business, and to find the best path for improvement of IST. To assist managers in this process, this study presents a network analysis of IT-CMF, by the use of graphs as a means to clarify development paths, which include areas to prioritize for the use of resources, and that are aligned with the objectives of the organization.
Keywords: IT-CMF; Capability; Competency; Graph; Information Systems; Information Systems and Technology
1. Introduction
Improving business performance, or even maintaining the competitive potential, is a daily and constant challenge for an enterprise. To strength its position in the market, an organization needs to change certain characteristics to a different state while preserving those characteristics that meet desirable parameters [Business Dictionary 2012]. This requires managers to make decisions from which a path to be followed by the organization towards defined goals should be derived. To best support their decisions, managers need information about the current situation and alternative options. Thus, Information Systems and Technology (IST) play a central role in organizations as fundamental resources to synthetize information.
Peppard and Ward [2004] identified three different eras of evolution for organizations, concerning their exploitation of IST, namely Data Processing, Management Information Systems, and Strategic Information Systems. These ages presented different challenges for the evolution of organizations, which influenced the development of different evolution models and maturity models. Such models depicted scenarios that might be faced by organizations and suggested paths for their evolution concerning technology, intending to achieve success in different aspects of the organization’s operating environment. The increase in complexity inside and outside organizations, and in the amount of available information, led to an increased dependence of organizations on IST, requiring organizations to better manage their information-related resources.
To help organizations respond to this information management challenge, new evolution models and maturity models that formulate relationships between IST and organizations emerged. One of the latest models is the Information Technology Capability Maturity Framework (IT-CMF). The design of the IT-CMF reflects the demand for differentiated analyzes about the possibilities of improving organizations by the exploitation of IST. The framework indicates knowledge and skills that an organization should hold in order to manage efficiently and effectively the organization’s IST function [Duarte and Da Silva 2013]. According to the provisions of the IT-CMF [IVI 2016], it is possible to carry out diagnostic and in-depth analysis for each of the 36 management areas that make up the framework. The framework also points out relationships between management areas and how improvements in one area may contribute to improvements in other areas.
The organization that wishes to evolve, based on new demands or on any factor that influences the alteration of any of its characteristics, should consider evolution paths that may enhance certain management areas that make up the IT-CMF, with the prospect of rising its business performance. However, there may be alternative paths to choose from, taking into account not only the objectives established for the areas of IT-CMF, but also considering the relationship between the areas. Given the interdependences between the 36 management areas, organizations may face a complex task identifying and making sense of different evolution paths. From this observation stemmed the motivation to carry out this study. To facilitate the selection of evolution paths by organizations through better use of IST, we conducted a network analysis of IT-CMF. For this aim, we resort to graph theory to make explicit the interrelationships, scope, and possibilities when prioritizing improvements in one or more areas of IST in an organization. Such a proposal also allows managers more clarity in decision making, in addition to greater assertiveness and efficiency in the deployment of resources for the evolution of organizations through IST.
The following section covers the literature review, setting the stage for a new way to apply IT-CMF according to the specificities of each organization. After the literature review, this work is composed of two other sections, related to graph theory and the proposition of using IT-CMF and graph theory to improve the application of organizational resources, highlighting different views about the relevance of each area covered by IT-CMF. At the end of this paper, conclusions are drawn and future work involving the application of this
proposal is advanced.
2. Literature Review
In this section, organizational success and measurement are discussed, taking into account the role that IST play both for that end and in that task. Then, evolution and maturity models for the exploitation and management of the organization’s IST are briefly reviewed. Afterwards, the structure of IT-CMF and the relationship between the areas composing this framework are put into perspective.
2.1 Organizational Success
The availability of information on a large scale does not guarantees, by itself, the success of organizations. The business practices of organizations must keep up with constant changes, as practices that are known to be successful in the past may not indicate success in the future [Fong 2010], as illustrated by what happened to companies with predominant market share a few years ago, such as Kodak, Blockbuster, and BlackBerry, that today no longer dominate the market, transmuted into a different business or just disappeared.
The measurement of the organization’s success should not be static and should not be based on simplistic and isolated measures. A tool widely used to measure the success of organizations is the Balanced Scorecard (BSC) [Kaplan and Norton 1992]. BSC aims to overcome weaknesses of indicators such as Return Over Investment (ROI) and Earning Per Share (EPS), noting that these are not sufficient indicators for continuous improvement and innovation, factors which are necessary for the survival of the organization in the environment in which it operates. The BSC authors advocate the integration of complementary indicators to assist in the evaluation of the success of the organization, taking into account the customer perspective, internal business processes perspective, learning and growth perspective, and the financial perspective.
The success of an organization depends on its sustainability and growth, requiring the orchestration of very different tasks, such as segment identification and market niche, development of products and services, acquisition of resources, development of operating systems, development of management systems, and development of the corporate culture [Flamholtz and Aksehirli 2000]. In order to obtain a competitive advantage, an enterprise needs to align resources with the business strategy [Khani et al. 2011].
Whether for the purpose of measuring the level of success, which in itself has become more demanding since it has to consider a multitude of parameters [Curley 2008], as instruments to know what is happening or as products or services by themselves, IST are a fundamental part of and for the success of organizations. It is therefore easy to understand the emergence of models to guide the exploitation and management of organizations’ IST.
2.2 Evolution and Maturity Models
Through changes in the characteristics of organizations, which occurred over several decades, the concepts of evolution and maturity were adopted in order to envision the progress of the organization and its maturity regarding the use of IST. Common to most models of evolution and maturity, designed to guide organizations to obtain greater support in business processes from IST, several factors were used to measure the current state of organizations and to indicate aspects to improve, based on concepts, such as, information systems planning, strategic planning of information systems, organizational learning, information systems management, alignment of IST with the business, and user involvement [Galliers and Sutherland 1991; Hirschheim et al. 1988; McFarlan et al. 1983].
The factors that help to assess the evolutionary stage of organizations, regarding their IST, are usually called variables, and should guide organizations to answer the following questions: Where are we? Where are we going? What will we do to get there? [Santos and Valdesuso 1985].
Although different concepts are employed in different models, the fundamental difference between evolution models and maturity models concerns the support given to the actions to be developed, in the search for a better relationship between organizations and IST [Rocha and Vasconcelos 2004]. Hence, maturity models may offer greater support to managers regarding the desired improvements, in comparison to the simplified architecture of the evolution models, which limit themselves to present characteristics of situations experienced by organizations and failing to suggest actions to be taken for improvement of the current situation.
Given the increase in complexity, regarding the possibilities of evolution and maturity of organizations, proposing directions that unveil evolutionary paths for the organization becomes challenging. The scope of most of the models designed so far has become limited due to the numerous possibilities provided by the use of IST. Ergo, there is a need for a holistic approach to extract value from IST, that pays attention to different sectors of the organization, their specific demands and relationships, making explicit the influences and dependencies existing between them.
2.3 IT-CMF
Based on the various scientific contributions conceived over decades of studies on the relationship between organizations and IST, the IT-CMF appears as a composite of maturity models, not limited to analyzing a specific context. The framework architecture includes 36 contexts for analysis, each with a maturity model that indicates a possible path to be taken by the organization that seeks to improve its relationship with IST in a management area, in an attempt to do more for less, concerning financial investments made in IST [Carcary et al. 2015]. Each IT-CMF maturity model is composed of five evolutionary stages, and the areas covered by the framework have guiding questions to assess the level of maturity, guidelines for the
evolution of the area, typical challenges for the intended evolution, as well as actions necessary to be performed by those responsible for the evolution of the organization. The areas, called Critical Capabilities (CC), are organized into four large groups, called Macro Capabilities (MC). These groups bring together areas that have equivalent objectives, which according to the provisions of IVI [2016], are:
Managing IT like a business (MC1): Composed of 14 CCs, it proposes to change the vision of how IT is considered, migrating from a cost center to a value center view, offering solutions to customers and existing problems in the business;
Managing the IT budget (MC2): Formed by 4 CCs, it includes challenges related to the cost of IT, such as unplanned costs, maintenance of legacy systems, and the difficulty of strategically investing in new technologies;
Managing the IT capability (MC3): It covers 15 CCs and refers to the maintenance of the services provided by the IT function and the development of new services, stimulating innovation in the organizational environment through services and solutions provided by IT; and
Managing IT for business value (MC4): It involves 3 CCs, which aim to ensure that IT investments will enable business benefits, fostering the view that IT projects are not technology projects, but projects that generate business value.
Theories and practices proposed by several of the maturity and evolution models known until the conception of the IT-CMF in 2016 were incorporated in this framework. The process of diagnosing the necessary improvements for the organization, which is also included in the framework architecture, will indicate a set of CCs that should be improved, according to the current situation of the organization and its business objectives.
Through the diagnosis of the organizational scenario, in line with what the framework suggests, the benefits from the improvement actions applied to a single CC or a group of CCs may contribute to several areas of the organization. Analyzing the relationships between the CCs, contributions to the improvement of several CCs are observed, which may be the result of isolated actions, but with comprehensive results. The relationships between the 36 CCs that make up the IT-CMF involve 230 contributions, either between CCs from the same MC or between CCs from other MCs, as shown in Table 1.
Table 1: Contributions between IT-CMF MCs
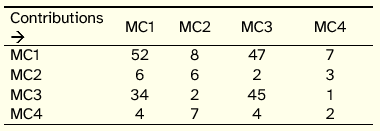
Considering the significant number of relationships existing between the CCs, the prioritization of CCs on the path to be followed for the improvement of the areas of the organization becomes complex. Therefore, it is necessary to understand better such relationships, specifically regarding the contributions provided and received by each CC, in order to assist managers on the selection of the best evolutionary path to be followed. This argument is related to the purpose of IT-CMF, to do more with less, making it possible to add value to the business through assertive investment in IST.
According to the data provided in Table 1, the relevance of MC1 is patent, both in the contributions provided by the CCs that compose it and in the contributions received by their CCs. On the other hand, there is a lower weight of the CCs of MC2, regarding the contribution to the other CCs, as well as the contributions received by the CCs that make up MC4. To enable a better representation of the CCs, visually indicating the existing relationships between them, making clear their contribution to improvement actions, we resort to graph theory, using representations as well as applying algorithms on the data compiled from IT-CMF. The application of algorithms enables the identification of communities of CCs that show greater proximity, identification of CCs with greater relevance in the framework, either in general or in the contributions received or provided, as well as showing the affected CCs through the improvements made in a single CC. The representations were made using software Gephi (version 0.9.2).
3. Graph Theory
Graph theory is a branch of mathematics concerned with the study of structures–graphs–that model relationships between objects. A graph is a representation formed by a set of points (vertices) and connections between points (edges), which can be used to represent different situations in the real world [Bondy and Murty 1976]. The history of graph theory began in 1736, in the famous dilemma of the Königsberg bridges. In this dilemma, the seven bridges (edges) and four regions (nodes) of the city of Königsberg were involved, which were cut by the river Pregel [Goldbarg and Goldbarg 2012]. Figure 1, developed by Rouse Ball [Gross and Yellen 2003], exemplifies the dilemma mentioned when he called the concept of graph. This example came from the challenge of the Königsberg population, which was to walk through all regions of the city without crossing the same bridge more than once.
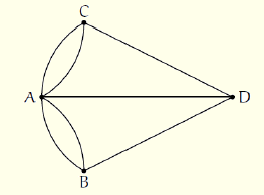
Figure 1: Graph diagram of the Königsberg bridges
One of the most used examples for graphs is about representing people, with lines representing the relationship between people, being able to demonstrate large concentrations and displacements on a map. Such a scenario is of great relevance for macro analysis and makes it possible to obtain results regarding the spread of diseases in the world. A current case for analysis is the evolution of the pandemic caused by the SARS-CoV-2 virus (COVID-19). When traveling, people end up transporting the virus to their cities but passing by large points of concentration of people, such as large airports (hubs).
Regarding displacement, the theory of graphs can also be applied to chess games, with each piece having a specific graph that indicates its displacement, citing the Queen, for example. The Queen is the piece that has the greatest number of opportunities in its displacement on the board and may have up to 8 possible edges and several vertices for its final position on the board, as shown in Figure 2. The queen is at the center of the graph, indicated by the non-empty point, having 25 vertices as the final position, depending on whether there is an impediment to displacement, caused by any other piece of the board.
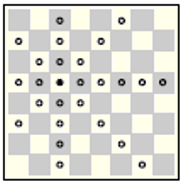
Figure 2: Chessboard
These are just a few examples of the use of graphs, from a myriad of applications in chemistry, operations research, social sciences, and computer science, to name a few. In this work, graphs will be used to represent the CCs and MCs of IT-CMF, to clarify how CCs are related and how they can indicate paths for the evolution of organizations, regarding their relationship with IST. The path to follow is based on the diagnosis of the improvements to be made, according to the objectives defined for the organization. In other words, the graph makes a clear sequence of actions related to the various CCs that make up the IT-CMF, through the improvements identified as necessary to the organization. In addition, it may indicate necessary paths to follow, that is, in the evolutionary path proposed for the organization, it might prove essential to mobilize certain resources in order to make feasible improvements in a specific area of the organization.
4. ANALYZING THE IT-CMF WITH GRAPH THEORY
The use of the concept of graphs for this work was thought of as a means to facilitate the understanding of the existing relationships between the areas addressed by IT-CMF, as set out in Table 1. Hence, it became possible to analyze all the CCs that make up the framework, as depicted in Figure 3, as well as a subset of CCs, such as those that make up each MC, as shown in Figure 4. In the figures, CCs are identified by a numeral and an abbreviation in square brackets (the meaning of each abbreviation is provided in Appendix A).
In both Figures 3 and 4, CCs are arranged following the distribution proposed by the Force Atlas 2 algorithm, being dimensioned according to their degree (corresponding to the inputs and outputs of each node–CC). The color of each node corresponds to the application of the Heat Map, with an emphasis on the CC with the highest degree in the analysis performed, except for MC2. This exception is because the CCs BOP(16) and FF(17) have the same degree, so the CCs are dimensioned by their centrality, and the colors with the application of the Heat Map are based in the CC with greater centrality.
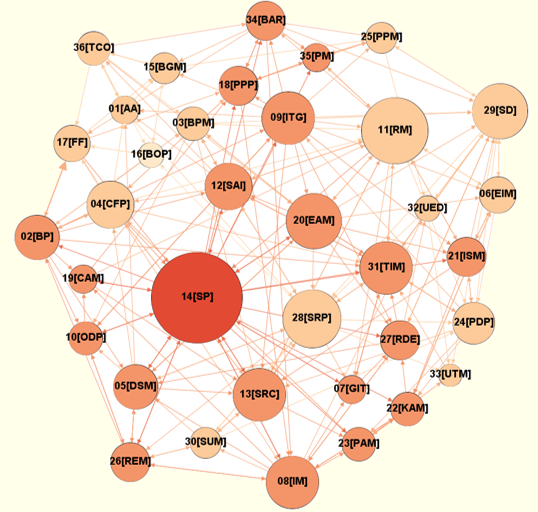
Figure 3: IT-CMF Critical Capabilities
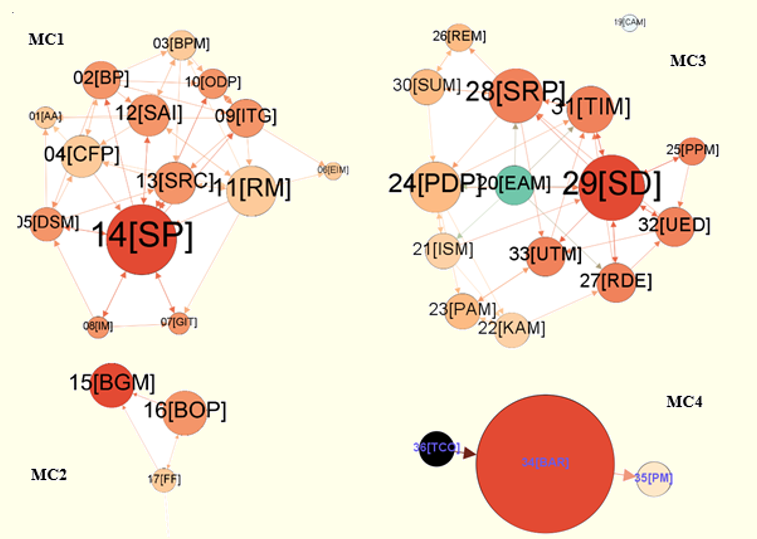
Figure 4: IT-CMF MCs and Their Respective CCs
The graphs reveal that CC SP(14) has great relevance in the framework, as well as for the MC in which it is located. It is noteworthy that CCs SRP(28) and SD(29) also reflect an equivalent degree of importance for MC, but in the global framework, they are less important. Concerning the contributions between CCs, it is noted that CC CAM(19) does not co-participate in the MC in which it is located, exercising relations in large part with the CCs of MC1 (7 CCs) and MC3 (1 CC). This fact strengthens and clarifies the essence of the framework, namely that the relationships between different sectors enable the organization to evolve. Thus, although CC CAM(19) works to raise the quality of MC3, its improvement will also facilitate improvements intended for MC1 and MC3.
Figure 5 strengthens this statement, presenting another point of view on the IT-CMF CCs. In this figure, the CCs are presented in colors that represent their communities, rendering the CCs that have the strongest relationship. This result was obtained through the distribution using Force Atlas 2 algorithm and the calculation of Modularity (0.238). It is noted, therefore, the existence of different communities from the corresponding organization with the MCs (presented in Figure 6), emphasizing again the argument of IT-CMF that although each CC has a main objective, leading to classify it in an MC according to its purpose, its evolution may contribute to the improvement of another area of the organization.
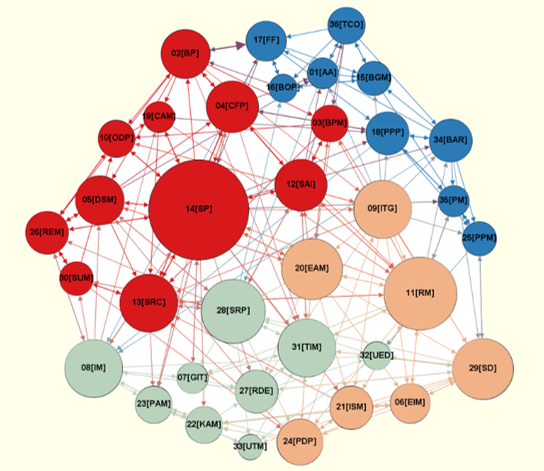
Figure 5: IT-CMF Emphasizing the Representation of CC Communities
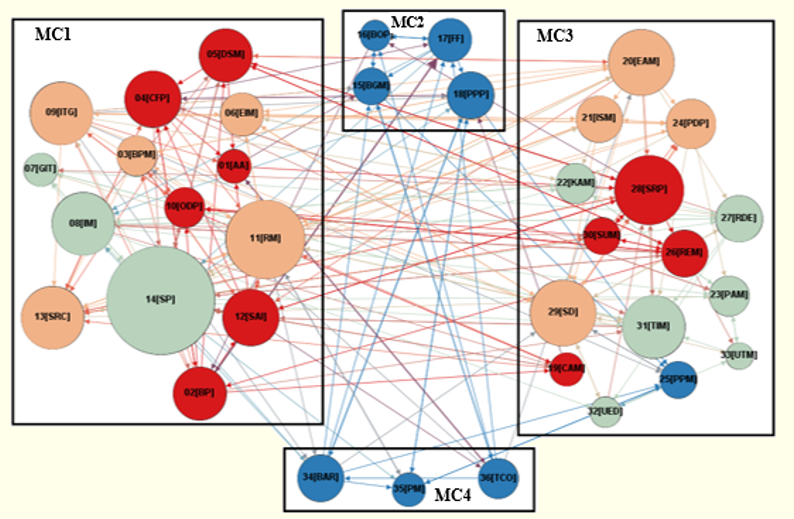
Figure 6: Organization of CCs according to MCs
Another representation derived from Figure 5 and shown in Figure 7 is to scale the nodes according to the degree value of each node, dividing it into two figures, one to represent the degree of the input and the other to represent the degree of the output. This representation is expected to contribute to the definition of paths to be followed to carry out activities related to the CCs, considering what should be prioritized in an evolutionary path of the organization. Such an argument considers the following scenario: let us imagine that managers identify as necessary to make improvements in CC BPM(03), belonging to MC1. Knowing that BPM is part of a community (resulting from the modularity of the graph) whose main facilitators are CCs BP(02), CFP(04), and SP(14), it makes sense to consider the contributions by these CCs, which will help to improve the organization’s BPM(03). It is noteworthy that CC BP(02) contributes directly to CC BPM and can assist in its evolution. On the other hand, the contribution provided by BPM to the other CCs should also be considered, regarding the relevance of these CCs to the organization. In this case, contributions resulting from improvements made in the context of BPM are directed to CCs ODP(10), SAI(12), SRC(13), EAM(20), and SD(29). If these CCs are also considered relevant to the business, the importance of using resources to improve BPM(03) is even greater. Another important insight is that CC EAM(20) has a high degree of output, contributing to several other CCs, as shown in Figure 7(B).
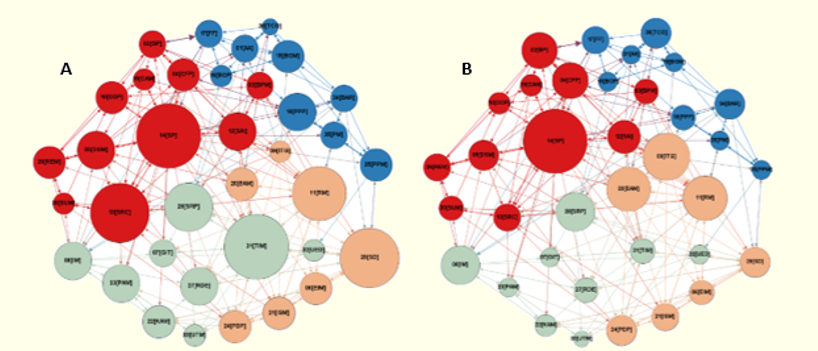
Figure 7: Input and Output Degree Comparison of CCs
It is also relevant to consider that there are four MCs, as documented in IT-CMF, coinciding with the number of CC communities identified by calculating the graph’s modularity. The similarities observed through the representation, shown in Figure 6, cover the fact that MC2 and MC4 are practically united in one community, with only one CC of MC3 grouped in that community. In the other communities, all CCs correspond to MC1 and MC3, being well balanced in their division between communities.
Referring to the relevance of MCs to the framework, it is evident that MC1 and MC3, by efficiently and effectively employing organizational resources in the evolution of their CCs, tend to enable a radical change in the organization, resulting from improvements in line with the objectives of CCs. However, although MC2 and MC4 have substantially fewer CCs, when employing organizational resources to improve these CCs, the contributions to the other CCs in the framework are above the average of the number of contributions provided by the CCs of MC1 and MC3. Table 2, as a complement to Table 1, shows the average of contributions per CC, taking into account the number of CCs in each MC.
Considering the contributions featured in Table 2, one notes that the relationship between the CCs of MC1 and MC3 are very strong, as well as the relationships that exist internally, that is, between the CCs of MC1 and MC3 themselves. However, when directing the relationship between these MCs and the other smaller MCs, the contribution is much lower than the contributions provided by the MCs composed of a lower number of CCs. The weakness, nevertheless, is part of the internal relations between the CCs, since, comparatively, the smaller MCs have, on average, less internal relations than the most numerous MCs. Therefore, when defining an IST improvement plan in an organization, it is necessary to visit the contributions provided by the smaller MCs, because at first, these MCs indicate that they have a more comprehensive impact in the potential results from the correct use of organizational resources. Being more specific about this example, when considering the CCs with the highest degree in the graph, in MC2 and MC4, respectively PPP(18) and BAR(34) (see Figure 4), and also because they are in the same community (see Figure 5), it is advisable that, even if such CCs are not prioritized, the contribution provided by them is validated, based on what the organization wants to achieve and if, indirectly, the path to the objective cannot be facilitated.
Table 2: Average Contributions from CCs (Grouped by MCs)
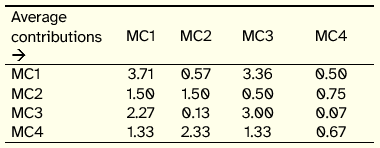
To clarify the relationships and contributions existing between the CCs of the MCs that make up the IT-CMF, Figure 8 makes a comparison of the direct relationship between the MCs. In Figure 8(A), the thickness of the edges (the size of the edge arrow) conveys, through the direction of the arrow, the contribution provided from one MC to another. It can be noted, therefore, the strength of the relationship between MC1 and MC3, as previously mentioned, in addition to also demonstrating the connectivity of the CCs that make up MC1 and MC3 (as revealed by the self-loops). Figure 8(B) depicts the total contributions divided by the number of CCs that make up the MC. In this representation, it is evident that, in all relationships, MC2 and MC4 provide more contributions to MC1 and MC3 than receive contributions from these MCs, making clear the need to provide attention to MC2–Managing the IT Budget and MC4–Managing IT for Business Value, even though, quantitatively, they are less expressive than the other MCs. The CCs that makeup MC2 and MC4 can act as great facilitators for improvements to be performed in different areas of management of the organization.
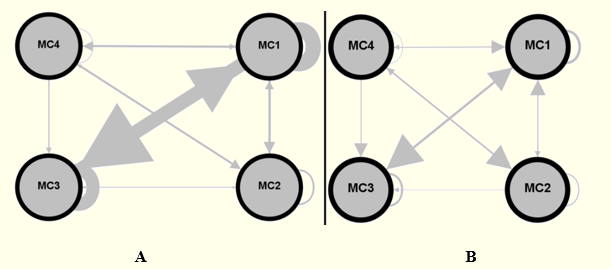
Figure 8: Relations and Contributions between MCs and CCs
5. Conclusion
In the face of a challenge, it is necessary to act. To act, the action must be well-founded, that is, be based on elements that support that the action performed was identified as the best option for the given moment. The decision for a path to be followed to make improvements in the organization needs to be as assertive as possible, as many organizations have no margin for errors, or, even if errors are part of the evolutionary path that the organization takes, they are never desirable. The proposal to use graphs as an aid to find the evolutionary paths for the organization, which are adapted to its needs, seeks to maximize the use of organizational resources in the adoption and use of IT-CMF.
Considering that IT-CMF is one of the most robust and mature references in the evaluation of the relationship between organizations and IST, it is of great relevance to explore it, to present different points of view for its application, seeking to facilitate the immersion of managers in the content provided. By conducting a network analysis of IT-CMF based on graph theory, it is possible to demonstrate, with greater clarity, how the management areas that make up IT-CMF are related, as well as revealing the paths that can be covered by the organization, in order to improve its use of IST. The possibilities for combining the graph concept with the framework are numerous, and it is believed that sufficient guidelines have been provided in this paper to suggest how managers can build the best roadmap to be followed, deploying organizational resources as efficiently and effectively as possible, focusing on the creation of aggregate value to the business by using IST. For future work, we consider the application of this proposal in different organizations to be extremely relevant. This would assist in the validation of the proposal of using graph theory for planning improvement actions to be carried out based on the IT-CMF.
Acknowlegments
This work has been supported by FCT–Fundação para a Ciência e Tecnologia within R&D Units Project Scope: UIDB/00319/2020.
References
Bondy, J. A. and U. S. R. Murty (1976). Graph Theory with Applications. Ontario: Macmillan.
Business Dictionary (2012). Evolution. Available at: http://www.businessdictionary.com/definition/evolution.html (Accessed: 15 August 2019)
Carcary, M., E. Doherty and C. Thornley (2015). Business innovation and differentiation: Maturing the IT capability. IT Professional 17(2), 46–53.
Duarte, A. and M. M. Da Silva (2013). Cloud Maturity Model. 2013 IEEE Sixth International Conference on Cloud Computing, 606–613. Santa Clara (Califórnia).
Flamholtz, E. G. and Z. Aksehirli (2000). Organizational success and failure: An Empirical Test of a Holistic Model. European Management Journal 18(5), 488–498.
Fong, K. (2010). The Five Elements of Organizational Success. Available at: http://elementalpartners.net/downloads/5_Elements.pdf (Accessed: 20 October 2019)
Galliers, R. D. and A. R. Sutherland (1991). Information systems management and strategy formulation: the Information Systems Journal 1(2), 89–114.“ Goldbarg, M. and G. Goldbarg (2012) Grafos: Conceitos, Algoritmos e Aplicações. Rio de Janeiro: Elsevier.
Gross, J. and J. Yellen (2003). Handbook of Graph Theory. New York: CRC.
Hirschheim, R., M. Earl and D. Feeny (1988). An exploration into the management of the information systems function: key issues and an evolutionary model. Proceedings of the Joint International Symposium on Information Systems, 4.15–4.38. Sidney.
IVI (2016). IT Capability Maturity Framework (IT-CMF)—The Body of Knowledge Guide. Maynooth: Innovation Value Institute.
Kaplan, R. S. and D. P. Norton (1992). The Balanced Scorecard—Measures that Drive Performance. Harvard Business Review 70(1), 71–79.
Khani, N., K. M. Nor and M. B. Samani (2011). A Proposed Research Model for the Relationship between Organizational IS capabilities , Organizational Performance and Strategic Planning. In Soliman, K. S. (Ed.), 16th International Business Information Management Association Conference 2011: Innovation and Knowledge Management: A Global Competitive Advantage, 770–782.
McFarlan, F. W., J. L. McKenney and P. Pyburn (1983). The information archipelago–plotting a course. Harvard Business Review 61(1), 145–156.
Peppard, J. and J. Ward (2004). Beyond strategic information systems: towards an IS capability. The Journal of Strategic Information Systems 13(2), 167–194.
Rocha, A. and J. Vasconcelos (2004). Os Modelos de Maturidade na Gestão de Sistemas de Informação. Revista da Faculdade de Ciências e Tecnologia da Universidade Fernando Pessoa, 93–107.
Santos, J. R. and C. Valdesuso (1985). Planejamento Estratégico e Tático da Informática, segunda edição. Rio de Janeiro: SCI-Editora.
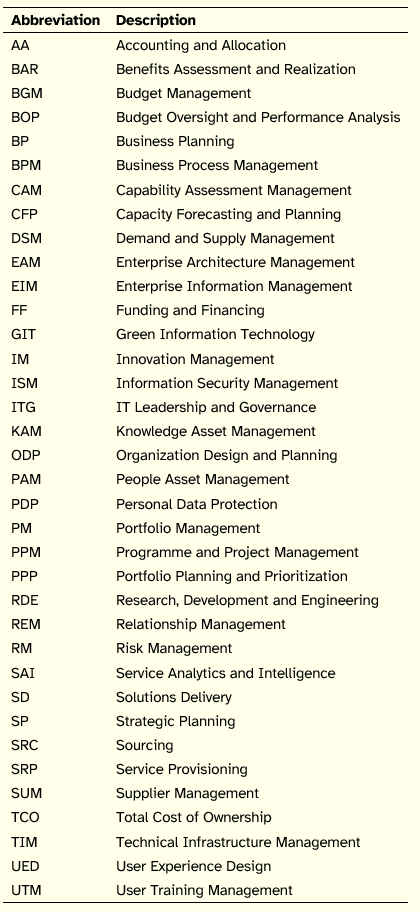
Appendix A—List of Critical Capabilities