Original source publication: Branco, Jr., T., I. M. Kawashita, F. de Sá-Soares and C. N. Monteiro (2020). An IoT Application Case Study to Optimize Electricity Consumption in the Government Sector. Proceedings of the International Conference on Electronic Government 2020—ICEGOV 2020. Athens (Greece).
The final publication is available here.
An IoT Application Case Study to Optimize Electricity Consumption in the Government Sector
a Algoritmi Center, University of Minho Guimarães, Portugal
b Modulus One Bahia, Brazil
Abstract
This paper presents a case study where sensor modules supported by Internet of Things (IoT) technology were used to monitor and control electricity consumption of air conditioning units in an innovation center of a public government institution. This study evaluates alternatives to improve the management of electricity consumption in Salvador City Hall’s facilities. To contribute to the economy and sustainability of the Administration, we aim to increase the efficiency of the processes currently adopted. Our focus is on minimizing electricity waste and reducing costs. Installed sensor modules measure electricity consumption and control the operation of air conditioning equipment, allowing the administrator to manage the operation of these devices. The installation of smart sensor modules connected to an IoT platform allows energy consumption data to be sent to a computing Cloud and to be monitored remotely through dashboards generated by specialized software. A quantitative analysis was conducted to measure the efficiency of the air conditioning control system and identify opportunities for applying the IoT solution to control natural resources in the public sector. The monitoring of these signals subsidized the analyzes required for informed decision making of interventions to improve the system’s stability and promote the reduction of consumption. Also, the system has demonstrated its ability to protect air conditioners, monitor the quality of the power supplied, proactively control consumption, and establish appropriate user behaviors for reducing consumption. Results demonstrated the feasibility of implementing automated systems to improve the consumption of natural resources in the public sector. We also identified some managerial behaviors required to enable this type of technological solution.
Keywords: E-government; Innovation; Internet of Thinks (IoT); Smart Technologies; Sustainability
1. Introduction
Presently, the control of electricity consumption in Salvador City Hall’s facilities is manually carried out that generates high operating costs and causes unnecessary expenses due to waste. Frequently, abnormal consumption caused by a defect is noticed after the fact and is only detected because it had caused an abrupt increase in energy consumption.
The concern with the consumption of electricity resources and the mitigation of problems related to its use are part of an institutional effort to adopt smart government (smartgov) and smart cities administration-related policies to promote the best management, governance, and sustainability practices. This study is part of an initiative of the Secretariat of Innovation and Sustainability (SECIS), which in collaboration with the municipal technology company, the Electronic Governance Company (COGEL), prepares studies in partnership with centers of technological excellence and the academic scientific community.
This study aimed to investigate the effectiveness of control systems based on IoT already used in the private sector to control the use of natural resources in the public sector. Focusing on identify potential gains and the scalability of these systems and organizational behaviours required for the implementation.
This paper is organized as follows. In the introduction, we present the research objectives and the methodology that guided our studies. In Section 2, we describe the theoretical approach, while section 3 describes the site where this study was conducted. Section 4 describes the technological architecture, i.e. the characteristics of the applied technological solution, the IoT platform, sensors’ technical characteristics, the network topology, the specification of collected data, and the software used for monitoring and controlling the sensor modules. In section 5, we present the measurements’ results and their respective analyzes. In section 6, we discuss the results’ projections and the expected financial and economic impact of the adoption of this solution in all facilities of Salvador City Hall and present our conclusion. We also recommend some behavioral practices when adopting this solution throughout Municipal public administration. Finally, we present paths for future research.
1.1 Research Objectives
Senior management of Salvador City Hall noticed that municipal government public agencies had consumed high levels of electricity in 2018. This fact triggered a series of studies that led municipal public managers to investigate and propose solutions for improving electricity consumption. These studies were conducted from June to September 2019.
In this sense, the purpose of the studies was to analyze and propose a technological solution to improve the use of electric energy resources in public municipal facilities. The solution monitors and controls electricity consumption using low-cost electronic sensing devices, readily available in the market, which are managed remotely in an automated way. Smart panels show consumption information. Panels show consumption graphs and statistics over any period, allow scheduling alerts in the system to automatically detect non-standard occurrences such as unexpected power consumption caused by instability of the supply system or defective equipment. Smart panels allow the administrator to proactively intervene in the power supply, in case of detection of any anomaly that may affect supply. He can request periodic maintenance for the network and equipment or can establish guidelines for the use of air conditioners based on consumption profiles.
MODULUS ONE is a local private company with expertise in innovative engineering and technology solutions involving IoT. It provided the technological solution, hardware and software, and the studies for solution’s suitability for the government sector were performed by technology analysts and technicians of the same company.
This research aims to achieve the following results:
Identify electricity consumption profiles in a given public environment;
Verify if the analysis of the measurement controls can indicate ways to improve electricity use;
Evaluate if the proposed solutions can be applied to other municipal administration facilities.
We expect that the analyzes of this study can be applied to all government agencies operating in this municipality.
1.2 Methodology
Current research explores the public administration’s perception of electricity savings in public buildings and provides evidence of the acceptance of the use of smart technologies for public administration monitoring and control of this resource.
The study was performed based on quantitative measurements of data collected in an IoT database and analyzed using algorithms coded into the control software. The technical standard PRODIST 8 [ANEEL 2018] was used to detect deviations of electrical voltage and to periodically measure the consumption recorded for the various sensors installed on the grid.
The consumption results presented by the algorithm embedded in the control software allow totaling the consumptions for each air conditioner in any predetermined unit of time. In order to identify the consumption in different environments and different equipment in one facility, the calculated totals are compared against the observed values for a given time frame. Thus, it is possible to identify the periods when consumption is high. A linear regression analysis [Kleinbaum and Kupper 1978] was used to identify the equipment consumption in a time unit of reference.
Root cause analysis (RCA) is designed for investigating and categorizing the root causes of events with safety, health, environmental, quality, reliability and production impacts [Rooney and Vanden Hauvel 2004]. An RCA, through its cause-and-effect diagram, was performed to identify consumption deviations and forward positive recommendations to improve user’s energy utilization.
2. Background
The technological evolution achieved in recent times provides conditions for the creation of solutions involving innovative concepts and has the potential to be applied in the government sector promoting sustainability. These solutions help improve operational efficiency, and when coupled with process optimization can reduce the use of natural resources. The solution proposed explores concepts and technologies such as e-Government, Smart Governments, Smart Technologies, and IoT for improving and optimizing government operations management. In order to better understand the potential offered by these technological and innovative concepts, we sought to identify some works that address these concepts and report experiences similar to this study. This framework aimed to clarify important details in the application of these technologies and gather experiences of lessons learned in other locations.
2.1 e-Government
According to Seifert [2003], e-government aims to continuously optimize service delivery, social participation, and governance by transforming internal and external relationships through technology, the Internet, and new media. The author states that e-government has six categories: Government that provides services to individuals (G2IS), Government to individuals as part of the political process (G2IP), Government to businesses as a citizen (G2BC), Government to businesses in the market (G2BMKT), government to employees (G2E) and government to government (G2G).
For Omura [2000], among many other advantages, e-government will lead to a reduction in paper consumption for government-business transactions (G to B transactions).
These technologies can serve a variety of different purposes: better delivery of government services to citizens, better interactions with businesses and industries, citizen empowerment through access to information, or more efficient government management. The resulting benefits may be less corruption, greater transparency, greater convenience, revenue growth, and cost savings [Almarabeh et al. 2016].
The relationship between government and a private company providing automated energy management solution services configures a relationship of the G2BMKT category. In this scenario, the government can interact with the company, acquiring solutions for its administrative processes, seeking operation costs reduction.
2.2 Smart Government and Smart Technologies
An intelligent city exploits sustainable Information and Communication Technologies (ICT) to improve the quality and performance of urban services for citizens and government while reducing resource consumption [Khajenasiri et al. 2007].
Schuurman and Tõnurist [2017] define smart governance as the process of collecting all types of data and information related to sensors or sensor networks public management. New technologies are harnessed to strengthen government rationale by using a complete - and more readily available and accessible - information for government decision-making processes and the implementation of those decisions.
According to Zheng et al. [2013], the smart meter is one of the most important devices used in the smart grid. The smart meter is an advanced power meter that gathers information from end-user charging devices and measures consumer power consumption and then provides additional information to the utility or system operator. Various sensors and control devices, supported by dedicated communication infrastructure, are used in one smart meter.
2.3 Internet of Thinks (IoT)
Internet of Things (IoT) is a network that allows new forms of communication between people and things and between things themselves. Each of the things or objects in IoT communicates with each other and plays a specific role. In an IoT network, each node acquires information on their own, and humans only verify the information collected [Park et al. 2014]. IoT can be used in transportation, healthcare, intelligent environments, etc. The main network systems for communicating with IoT are radio frequency identification (RFID) systems, wireless sensor network (WSN), and RFID sensor network (RSN) [Park et al. 2014].
In a world of multi-stakeholder information and asset delivery, and millions of things interacting and communicating in real-time, IoT-based systems aim to exploit these assets in a resilient and sustainable manner [Kyriazis et al. 2013].
Intelligent energy control in buildings is an important aspect of that world. The Internet of Things can provide a solution. Its goal is to connect multiple heterogeneous devices across the Internet, supported by a flexible tiered architecture, where things, people, and Cloud services are combined to make an application task easier. A smart home can be considered a subcategory of smart cities. In this subcategory, household appliances, lighting, heating, and air conditioning systems, video and audio devices, and security systems are capable of communicating with each other or use a central control unit to communicate, in order to provide comfort, safety, and energy efficiency for homeowners [Khajenasiri et al. 2007].
2.4 Related Works
The use of IoT for monitoring of electricity consumption is a well-known practice, notably to homes and private buildings. Moreover, some authors report successful case experiences in the public sector regarding the use of similar smart equipment.
Energy-saving is a major issue due to the proliferation of climate changes and global energy challenges [Bhati et al. 2017]. According to these authors, people’s perception of the use of smart technology for energy saving is still in its conceptual phase. It means that people talk about environmental awareness, but do not change their consumption habits and continue to pay the electricity tab. Given the availability of electricity and its essential role, modulating consumer attitudes toward energy savings can be a challenge. Also, according to Bhati et al. [2017], the current design gap of smart
technology in smart homes is understanding consumer behavior and integrating that understanding into smart technology.
Vassileva and Campillo [2016] report a case study of a large-scale implementation of smart meters integrated into a smart power grid in the city of Vasteras, Sweden. They concluded that the advantage of smart meters is the ability to collect consumer data, which is easily accessible through a website or mobile app. Consumers can overview of their consumption patterns, what they can act on, and how to reduce their use of devices. The survey also revealed some gaps in consumer interactions with smart meters, as can be seen from consumer feedbacks and preferences on how smart meters can be enhanced. Another advantage of smart meters was the dynamic use of tariff-based electricity that allows consumers to be guided at peak times and in choosing specific energy suppliers.
An additional case study reported by Bhati et al. [2017] regarded the installation of smart meters and online display of household electricity consumption in Singapore, one of the most densely populated cities in Asia. Energy-saving behaviors in homes were investigated using home displays and smart meters. Raw energy data, statistical data, and background information were stored in dedicated databases so that researchers could work on their data separately. The findings of this study were categorized into topics such as frequency checking, power saving, standby power saving, and in-peak and off-peak power consumption. Household energy consumption was smoothly distributed over 24 hours. In homes where there were no screens to monitor consumption, the demand for energy was much higher between 7 p.m. to 11 p.m. compared to families who could monitor their consumption. This case study demonstrated that households’ energy-saving behavior had changed positively due to the installation of smart home technologies.
Park et al. [2014] present another study of the application of IoT technology using electricity measurement sensors in historical buildings in the city of Singapore. The authors were involved in the development of an ICT-based power management control system to prevent possible damage caused by major facilities interventions due to the installation of power management hardware. In this project, a computer-based system controls lighting, heaters, air conditioners, and other environmental units in large buildings. This solution provides a software-level central control system that connects wirelessly to power structures placed in different parts of a building or even in multiple buildings. In addition to the hardware, the most significant result was the development of an energy efficiency model for existing buildings and public spaces. These systems use IoT software and hardware infrastructures to achieve their goals.
3. Study Site
The place chosen for piloting the experiment was the COLABORE center for technological innovation, specially designed by Salvador City Hall to test new smart and sustainable technologies for the public sector. Figure 1 shows a picture of the innovation center facilities located in one of the city’s municipal wooded parks.
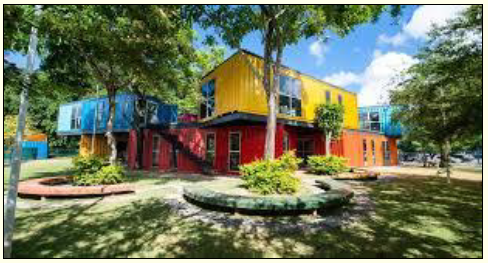
Figure 1: COLABORE Innovation Center
Source: Salvador City Hall
In this space, recycling disused ship containers, the city built eight integrated buildings. These containers were designed to serve as a collective space for offices and classrooms. Government, private entities, and startups focused on innovation, technology, and sustainability share the area to promote entrepreneurship initiatives. Some spaces are also available for public use. Any interested party can book a space to perform various activities.
All buildings have lawns covering their roofs and a plumbing system to collect and reuse rainwater and water that drip from air conditioning (AC) units. The complex also has a small sewage treatment plant which, by pumping, stores it in tanks located on the top of the containers. Waters are used to irrigating the lawn on the roof of the containers and surrounding green areas and recycled in sinks and toilets.
This space also has other innovative initiatives, such as photoelectric cells panels for harnessing sunlight, accessibility solutions, and many others. More recently, the sensor modules, object of this study, were installed in these facilities. The network infrastructure and the modules containing the sensors were installed in June 2019. Monitoring for this study occurred until September 2019.
The innovation center is composed of 8 maritime containers. Six containers have two air conditioning devices; one container has three units; and one with one air conditioner. Sixteen sensor modules were installed, one for each equipment. The installation process was straightforward since the modules work in plug & play mode, and no configuration was required.
The installation of the sensors was simple and carried out in one day. As the electrical circuits that power each air conditioning (AC) unit are insulated to prevent short circuits, it was possible to install each sensor module besides the AC unit. The energy that feeds each equipment passes first through the module and enables the module’s cut-off relay to take control of the energy flow to allow the unit to operate according to previously programmed parameterization.
4. Technological Architecture
The system architecture is composed of the following infrastructure: modules containing the reading sensors/actuators (meters), a gateway that is used as a bridge, the network infrastructure, the Cloud computing, a database that supports BIGDATA, and the software for sensors’ remote management. Figure 2 presents the technological architecture used in this study.
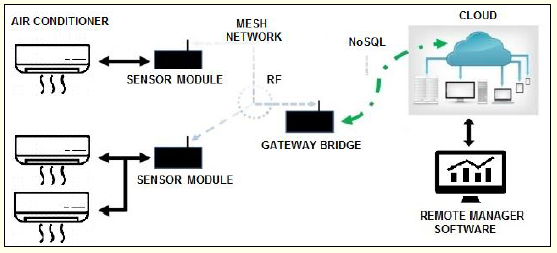
Figure 2: Technological Architecture
All devices of this platform, described below, are enabled with IoT technology.
4.1 Sensor Modules
The sensor modules are responsible for receiving and sending the electricity flow to the remote management system. Modules can act as actuating devices, interrupting the electricity flow to the air conditioners according to preprogrammed parameters.
The sensor modules pass the energy flow information to a Gateway, allowing power telemetry measurements and event alarms to reach the modules’ remote management system.
Each module has Mesh network functionality and operates via radiofrequency. It is powered by a current which voltage ranges from 90 to 250 Vac. In standby, consumption is set to 1.5 W and assumes the nominal consumption of the associated AC unit when in operation. The radiofrequency module with physical layer FSK modulated has a zero-gain antenna for receiving signals and works in an ISM band on 918 MHz frequency. The module operates in the frequency range from 915 to 928 MHz.
Each module is attached to the following peripheral devices: a shunt relay, a real-time clock, a temperature sensor onboard the motherboard for measuring the module’s internal temperature, a power meter for measuring electrical quantities such as the electric current, voltage, active and reactive power, and one sensor to detect unauthorized interventions. This system measures the air conditioner performance and detects degradation, in which case it issues event alerts that indicate the need for maintenance intervention.
It is possible to make these measurements of each of the air conditioners individually or grouped in a pre-established set. The sensor module can detect power supply anomalies that can cause some unit operation problems.
The real-time clock works with energy stored in a super capacitor and does not require batteries. The microcontroller allows the module to program time profiles to determine the activation and shutdown times of an air conditioning unit. The module does not perform the temperature modulation system. It is operated directly on the thermostat of the air conditioner, using the original control of the unit.
The proprietary communication protocol is developed in open source and is capable of integrating other modules through APIs. (OMITTED ON PURPOSE), the devices’ supplier, performed all programming and developed and implemented all network link layer protocols.
4.2 Gateway Bridge
A Gateway Bridge device has been installed in the COLABORE space. This bridge acts as a communication link between the field network that operates on radio frequency and the Internet network that transports the collected data to the remote management platform.
Each bridge can receive and send information for up to 1000 sensor modules. The device runs LINUX software. A bridge has embedded communication software, which enables sensor modules to communicate via radiofrequency. Data communication to a Cloud Computing is made possible through the Internet network. It is desirable to have a stable Internet network with appropriate bandwidth to avoid time-out effects when signals are expired by the Internet network low latency. Such effects, however, do not interfere with the operation of sensor modules, which operate through self-stored programs.
This device operates with electrical voltage in the range of 90 to 250 Vac. Using a public Internet IP, the bridge communicates with the system application servers on the Cloud. The device can connect to the Internet using the local Internet network or operating with 3G or 4G technologies or using the metropolitan mobile network. Data always travels through VPN tunneling and uses AES128 / 256 standard encryption. The sensor modules solve any speed problems through boundary processing. In the boundary process, field devices perform analysis and actuation on the sensor module’s own processor, reducing gateway processing and bandwidth consumption.
The difference between this Gateway and others on the marketplace is that it does not assume the role of network coordinator, in which case the device stores routes and pairs communication with other modules. In this case, if the device malfunctions, all programming is lost.
The Gateway device used in this solution works with a distributed intelligence paradigm, i.e., the sensor modules do the boundary processing and send the data to the other modules of the system, operating on Mesh network principles. Whereas in the distributed programming paradigm, sensor modules can record programming and the gateway does not assume the role of coordinator, performing only as a bridge of communication with the Internet network through a VPN. There is no pairing between the gateway and the sensors. Pairing is done through the sensors themselves.
In case of failure, the Gateway can be replaced with a similar device, preserving only the public IP. And the nodes of the network are not affected; thus, the sensor modules preserve all their programming and settings.
4.3 Mesh Network
The communication network infrastructure between the sensor modules and the gateway is through a mesh network.
The wireless Mesh network is based on the 802.11 wireless local area network (WLAN) and has been actively used for some years. In order to improve the performance of WLAN mesh networks, some new communication protocols have been developed in recent years [Wang and Lim 2008]. Figure 3 shows a schematic of the 802.11s architecture Mesh network.
The system’s Mesh network infrastructure is composed of the set of communications nodes and the bridge. In this type of network, all nodes communicate directly to each other. Communication does not require routing tables. This configuration paradigm makes installing modules and gateways easier, resulting in greater resilience in overcoming obstacles or shadows. For example, when the gateway sends a signal one km away, and there are sensors along the way to pick up this signal, the network nodes will repeat the signal to the other nodes. Nodes that belong to different groups can transmit other types of signals in different groups, so the signal can reach the gateway.
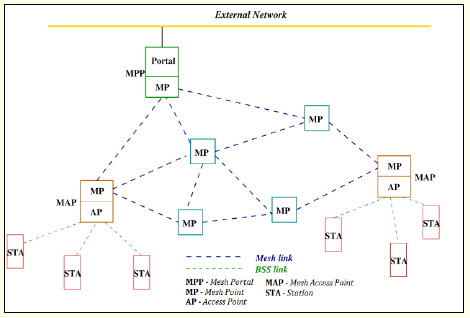
Figure 3: Mesh Network
Adapted from [Wang and Lim 2008, p. 972]
The Mesh network environment has the following characteristics: use of IoT data communication protocol, applicable to RF Mesh networks and based on open technologies; distributed intelligence - no coordinating elements; no routing tables (communication resiliency); integration of different devices forming a heterogeneous network; definition of all layers; single-command commissioning devices
Communication protocols possess the following technical characteristics: Gateway plug & play; AES128/256 encryption; FSK and LoRa modulations; and Integration API.
The minimum requirements for infrastructure operation involve a server with 64-bit dual-core Linux virtual machine, 30 Gb hard disk and 4 Gb of RAM.
Although Mesh communications can travel over a regular network, signals from different devices can be grouped so that they are not shared. This process provides greater communication resilience for field devices. The programming of the signal transmission code does not allow the system to go into infinite loops, which prevent network congestion.
4.4 Cloud Computing
Cloud computing is location-independent computing where shared servers provide resources, software, and data to computers and other devices on demand. More simply, it can be seen as remote computing [Ramya and Ramya 2015]. Figure 4 shows a schematic of a Cloud.
The Cloud computing infrastructure adopted for this solution was Amazon’s Platform as a Service (PaaS) AWS-EC2 [AWS 2019].
Servers are housed in two data centers: one in South America, located in Sao Paulo, Brazil and the second in Europe, located in Ireland. Data centers have been contracted with load balancing and allow processing and data mirroring.
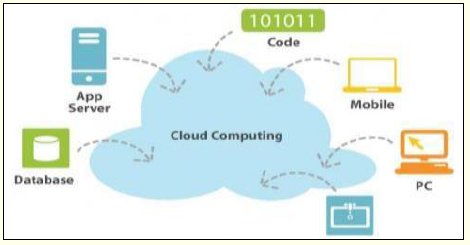
Figure 4: Cloud Computing
Source: [Ramya and Ramya 2015, p. 1]
The system uses a regionalized DNS depending on the location of the server that accesses the system that connects the nearest Cloud server. In the event one server is unavailable, the other takes over data storage. Storage reference is performed by geographic referencing. The Cloud identifies the connecting gateway using its IP geographical location and directs the traffic to the appropriate data center.
4.5 NoSQL Database MongoDB
Power flow data captured from field sensor modules pass through the platform Gateway bridge to be stored in a NoSQL MongoDB Cloud database.
Sensors are used to monitor certain aspects of the physical or virtual world, and databases are often used to store the data these sensors gather. Sensor usage is increasing, which leads to increasing demand for sensor data storage platforms. Some sensor monitoring applications need to automatically add new databases as the size of the sensor network grows. In this context, NoSQL databases have gained strength over the past two years due to the increased scalability and availability requirements [Pokorny 2013].
NoSQL databases are designed for simple hardware. In addition to cloud computing, NoSQL databases are popular among Web 2.0 applications, where the horizontal scale involves thousands of nodes. It is no coincidence that NoSQL databases with the greatest impact on this software category originate from Google and Amazon development labs [Pokorny 2013].
MongoDB is a document-oriented, nonrelational database. Application dataset sizes are growing at an incredible rate. Increasing available bandwidth and cheap storage have created an environment in which even small-scale applications need to store more data than many databases can store [Chodorow 2019].
4.6 Remote Management Software
The software platform for remote management was developed by the company MODULUS to process the data measurements made by the sensor modules.
The software combines several programming languages. One part uses HTML5, Java, and Python. It uses ERLANG, a telecommunication specific language, for some functions backed communication.
Within this platform, users are allowed to view data in graphs or tables. Data can be exported to formats that may be consumable for other BIGDATA technologies for further analysis.
The platform allows to view telemetry, create statistics, and view electrical devices power consumption, programming operation parameters, although the code is stored in the network nodes.
The system permissions module allows the definition of various user access levels. Specific permissions can be set up for the administrator, editor, or viewer categories. The administrator can perform all operations available on the system. The editor role has access to some settings but cannot register new users. The viewer role can only query data. Viewer profiles can be specific to restricted or unrestricted viewer functions. Profiles allow configuring networks where viewers are given access to resources through permissions assignment. MODULUS owns the software and makes it available to users under an annual license fee.
5. Results
COLABORE innovation center analyzed the telemetry results, which consist of data of one facility composed of eight environments with 16 air conditioning units.
First, we determined the consumption of the air conditioning system during the entire testing period from June to September 2019. Then we compared it to the total consumption of the government facility to assess the representativeness of the air conditioners in regard to the total energy consumption. Secondly, we restricted the study period to the week 2019/09/14 to 2019/09/22 to identify the daily consumption of air conditioning units and learn users’ behaviors habits.
For this experiment, sensor module parameters were not initially programmed, so sensors could perform unbounded. The intention was to create a baseline with telemetry of each air conditioning unit actual electricity consumption and observe how users behave, in order to identify their usage habits.
This study obtained the following results:
Total consumption for the test period from 2019/06/22 to 2019/09/22—One of the objectives of this study was to determine the relation between the power consumption of all air conditioning units and the facility’s total electricity consumption.
Telemetry data analysis—Occurrences in consumption of the use of air conditioning units were identified. The demands of using the devices in their respective environments were measured. The analysis of these data allowed us to establish specific usage profiles for these environments.
Simulations—Simulations of use were performed in an environment controlled by automated programs versus measures acquired for the baseline (unrestricted use). The analyzes allowed to verify if the controlled environment can point out ways to improve electricity consumption;
Behavior identification—User behaviors were identified, and the challenges for rational and optimized use of the system were listed.
5.1 Test Period Total Energy Consumption
This study measured the energy consumption of the air conditioners from 2019/06/22 to 2019/09/22. During this period, air conditioners consumption measurement was 6.000,491 kWh. At the same period, the facility’s electricity bill indicated a total electricity consumption of 23.094 kWh. Therefore, the electricity consumption of all air conditioning units corresponded to approximately 25.98% of the total consumption. Figure 5 presents a graph representing the relation between the electricity consumption of air conditioning units in regard to the facility total power consumption.
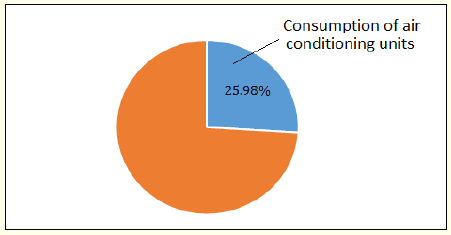
Figure 5: Consumption of Air Conditioning Units
From June to September 2019, the Collaborate Center spent approximately US$ 3,375, including taxes, on electricity. The cost of the kW/h applied to Salvador City Hall is US$ 0.15. Thus, the energy consumption of the air conditioning system was approximately US$ 900.
The relation between the facility’s total electricity consumption and the air conditioners has shown that the units are responsible of over a quarter of the total energy consumption.
This finding attests to the importance of controlling the use of the air conditioning units.
5.2 Telemetry Data and Analysis
The remote management software provided the telemetry data and their analysis. To identify users’ behaviors and consumption habits related to the usage of air conditioning units, we created a sample of the results of a system query ran between 2019/09/14 and 2019/09/22.
This sample is sufficient to evaluate the potential monitoring, management, and control implementation rendered possible by the use of this system. Thus, the system query module provided the following statistics during this period:
The actual state of sensor modules - Pie chart containing the percentage of devices operating normally relative to devices with nonconforming events and the ration of events occurrences/sensor.
The power consumption of the all air conditioners in the facility, in each environment per period (set by the system operator). This statistic is available to the administrator as follows:
a data table containing consumption values;
a bar graph comparing units’ consumption;
a line graph indicating daily consumption.
5.2.1 Sensor Module Actual State Chart
The pie chart indicates which sensors are in normal operation and which are not. Figure 6 illustrates the chart generated by the system.
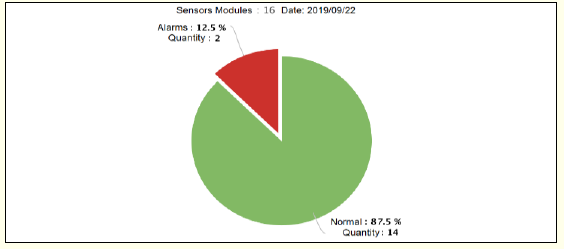
Figure 6: Control Chart
On 2019/09/22, the remote management software pointed out that of the 16 sensor modules, 14 were in normal operation, and two were defective. The list of defective modules on this date is presented in Table 1.
Table 1: Events
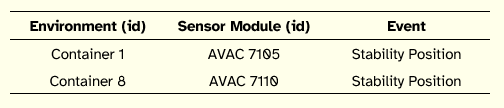
Analysis of these data indicated that there was evidence of manual handling of the sensor modules, destabilizing them from their original positions. The administrator should request maintenance personnel to check the status of these devices and to reprogram their position in the system.
5.2.2. Electricity consumption of all air conditioning units
Table 2 presents the statistics generated by the system on the electricity consumption of all eight environments of the facility from 2019/09/14 to 2019/09/22.
Table 2: Total Air Conditioning Electricity Consumption in a Public Agency
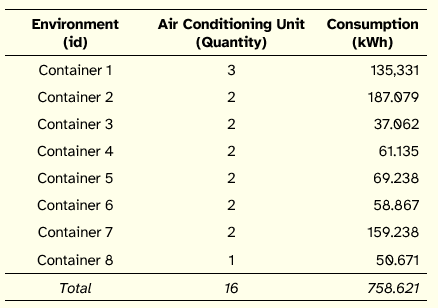
Figure 7 shows the consumption of all air conditioning units for the period between 2019/09/14 and 2019/09/22.
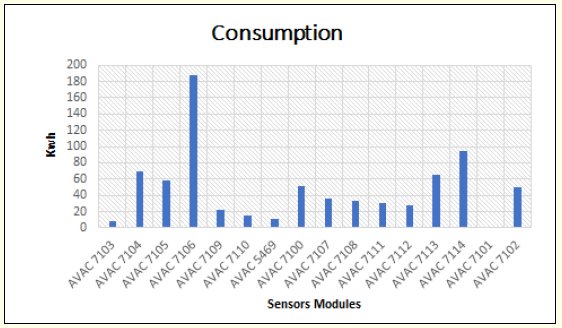
Figure 7: Consumption Readings
The analysis of the energy consumption in this facility revealed the existence of expressive differences of consumption between the air conditioning units. The administrator should investigate why there are such differences in consumption to assess whether any administrative action should be taken.
Figure 8 presents a graph illustrating the total government facility’s electricity consumption per day.
The analysis of these data provides the administrator means to determine and set an expected consumption value of the facility for a certain period.
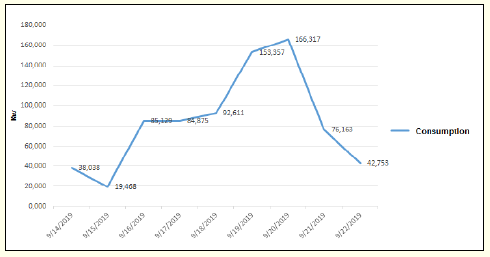
Figure 8: Total Consumption per Day
Data observed in normal situations may support the manager’s decision to set a cap on energy consumption over similar periods.
Thus, event alarms can be programmed to indicate consumption that exceeds the upper limit set by the administrator.
5.2.3 Energy Consumption in a Specific Government Facility Environment
To illustrate the feature to query consumption by environments, we have selected the environment Container 1, which houses three air conditioning units.
Table 3 presents the data obtained by the remote management system about the energy consumed in this environment during the period of this sampling.
Table 3: Data Consumption of Container 1
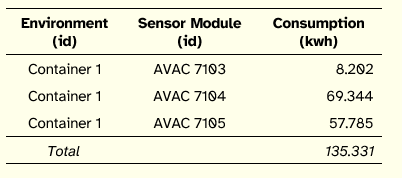
Figure 9 presents a line graph that shows the variation of power consumption in this environment (Container 1) on weekends (begin and end of the chart) and weekdays (mid part).
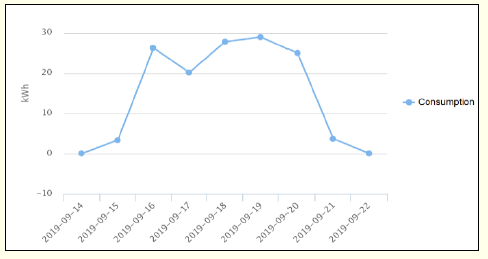
Figure 9: Graph of Container 1 Electricity Consumption
The remote system also generated the graph of the energy consumption of the three air conditioners installed in this environment, as showed in Figure 10.
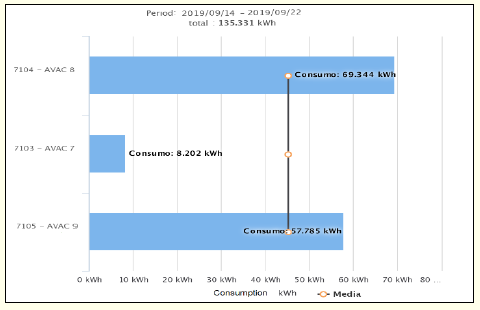
Figure 10: Comparative of Electricity Consumption in Container 1
The analysis of energy consumption in this environment showed that although there are three air conditioners, one of them was little used compared to the other two. This fact suggests that this unit may be underused in this environment. This information may suggest that the administrator investigate the causes of this occurrence and even decide if this equipment can be removed from this environment.
Consumption data of any environment is available in graphical format.
5.3 Simulations
Simulations show the expected electricity consumption savings if the air conditioning units were turned on only during working hours, for Salvador City Hall, it means Monday to Friday, 8 am to 5 pm.
The simulations developed using RStudio project. R is an open-source software environment for statistical computing and graphics based on regression analyses. RStudio project renders the use of R easier and more productive [Verzani 2011].
The remote management platform allows to export collected data into .csv format, which can be consumed by many analytical software. In order to analyze the behavior of the air conditioners, a week’s telemetries were gathered, exported and treated in Excel, to create a dataset. That set of values were imported to a R programming environment - RStudio, where subsets for each air conditioner unit were generated.
Using R functions, developed for this analysis, it was possible to obtain deviations, considering the misuse of the devices out of working hours–8:00 am to 5:00 pm. The function was parameterized to detect operation of the unit by using a threshold of 50 mA for the current measurement; time was measured as elapsed time in minutes. Deviations were calculated in kWh. Table 4 shows the consumptions and the deviations per air conditioner from RStudio.
Table 4: Deviations per Air Conditioning Unit
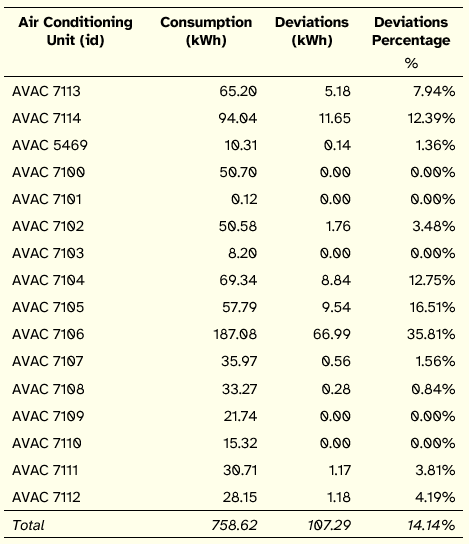
The data in the Table 4 indicate that amongst 16 equipment, 11 were operating outside working hours determined by the Salvador’s Municipality. In one case, the deviation reached 35.81%. With this information, the manager can investigate the causes and know the motivation, employing corrective measures, if applicable.
The graph in Figure 11 shows the expected consumption after programming the hourly profiles in relation to the actual consumption measured.
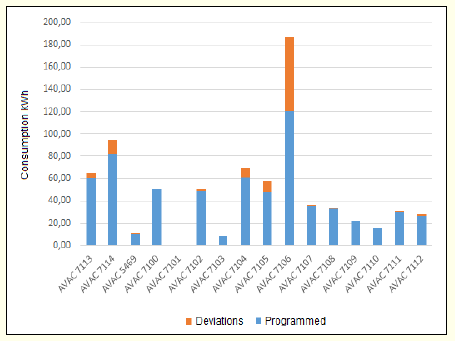
Figure 11: Deviations Evidenced
Results show 107.290 kWh of total deviation that corresponds to 14.14% of the total (758.621 kWh) consumption in the test period. The management platform allows users to program hourly profiles that will generate a cost reduction corresponding to the deviation.
Electricity consumption savings at this unit was approximately US$ 127.26, considering the June-September 2019 test period.
5.4 Observed Behaviors
The analyzes obtained in this study pointed out some inappropriate user behaviors that should be avoided. We used Root Cause Analysis to address these behaviors.
According to Rooney and Vanden Hauvel [2004], root causes are specific underlying causes that can identify which behaviors management has control to fix and propose recommendations for preventing recurrences.
In this sense, a group composed of analysts, administrators, and advisors was formed to discuss the causes inappropriate behaviors. The group conducted a root cause analysis using cause-effect diagram on the various behaviors and has made some recommendations to mitigate these deviations.
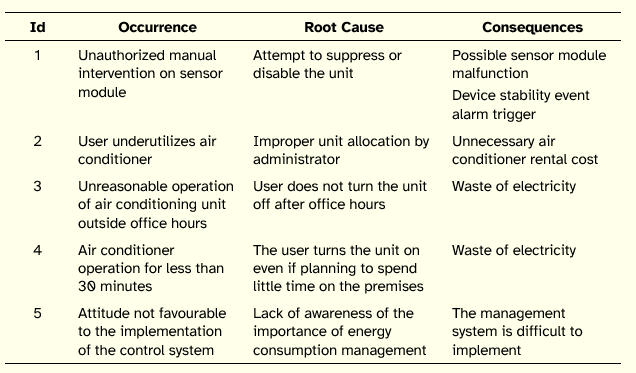
Table 5 lists the cause-effect diagram of the principal occurrences of inappropriate behaviors, the root causes of these events, and their consequences.
From the facts found and the main causes identified, the group elaborated the following behavioral recommendations:
Occurrences 1, 3, and 4 can be mitigated through the implementation of the system under study, as it provides for a process for automating the scheduled operation of air conditioning units in municipal public administration facilities;
Occurrences 2 and 5 are related to users’ awareness of the importance of managing energy consumption in the institution. Therefore, the support of managers and administrators of the facilities becomes of fundamental importance for incorporating these processes in the organizational culture.
Table 5: Cause-effect Diagram
Two factors are critical for the successful implementation of this type of system: strong upper management support and adequate system management.
6. Discussion and Conclusions
This study was useful to verify energy consumption profiles, assess potential waste causes, and plan the optimization of the air conditioning unit’s operation for the lowest electricity consumption.
This section highlights the benefits, and challenges faced when implementing this system. Additionally, we provide a system’s general evaluation and finally, synthesize our conclusions.
6.1 Benefits
The benefits of implementing this IoT solution related to electricity savings involve the quality of electricity supply; the discovery of the peak consumption periods; and understanding the behavior of users regarding the use of this resource.
The monitoring of these signals subsidized the analyzes required for informed decision making of interventions to improve the system’s stability and promote the reduction of consumption.
Also, the system has demonstrated its ability to protect air conditioners, monitor the quality of the power supplied, proactively control consumption, and establish appropriate user behaviors for reducing consumption.
The elaboration of strategies to reduce electricity consumption in this government institution, through the analysis of its use, is a measure related to the sustainability and economy of public resources.
6.2 Challenges
This study identified that the challenges of the implementation of a monitoring and control system using sensor modules for reading energy consumption of air conditioning units lie on the human behavior domain since technically, the solution is simple and straightforward. Observing users’ behaviors and the consumption statistics obtained through the measurements, we can relate the following behavioral difficulties:
Paradigm shift—User loses the control of turning the air conditioner on and off;
Remote management software operation required—Hours of operation must be programmed in the unit by a user, which needs to be registered in the system and given “ The difficulty of operating the remote management software—Not all Salvador City servants can operate computer systems, however, easy their operation. In these cases, there may be resistance to controls previously programmed by software.
Lack of awareness of the need to improve the utilization of public resources with electricity costs—Some public servants may not understand the need for the public institution to reduce energy costs. Need to raise employees’ awareness of energy savings and better use of natural resources;
Unnecessary operation of air conditioning units in the event of unplanned events—These occurrences may harm energy savings. For example, the facility does not open in a day that it is supposed to open, and the system manager fails to change the unit schedule. The air conditioning system will operate normally, causing a waste of resources.
6.3 General Evaluation of the System
The system was stable and appropriately collected and stored sensor data.
The Mesh network proved to be very efficient, and the IoT technology was considered adequate to the overall system operation and engineering. At all times, latency and degradation data traffic on the Internet network was not detected. Cloud servers met expectations for data center operations and availability for data storage and retrieval.
The remote management software contains the necessary functionalities for parameterization, user permission granting, and programming of its main functions. Users deemed the operation of the system to be easy and intuitive.
Although the information available through tables and graphs is easy to understand and interpret, the queries have some limitations. The system allows the export of data in other applications’ format such as spreadsheets; however, a grouping feature is not available so that operator can select network groups or institutions that may need to be analyzed. For example, it is not possible to select all Secretary of Education facilities and group them, so the software can perform simple statistics such as obtaining of the total consumption of these facilities, their environments, and individual air conditioning units. The workaround is to export the data for each unit to a format like Excel and compile management statistics elsewhere. Another limitation of the system is that it does not display the timestamps when queries and reports are executed. Keeping temporal references is important, for comparison, temporal analysis, and auditing. Requests for changes have already been placed with the vendor, and these shortcomings may be solved in future releases, so the system may become a viable acquisition for Salvador City Hall.
6.4 Conclusions
This study provided the Administration with important knowledge about electricity consumption in Municipal facilities and offered supporting data for informed decision-making before intervention in the air conditioning systems. Proactive interventions make it possible to correct failures and determine the best distribution of air conditioning units across municipal administration facilities. Air conditioning usage guidelines and rules can be created for reducing energy consumption.
With the aid of measuring platforms, it is possible to check consumption profiles, gauge potential waste, and enable cost reduction.
Another important factor is the amount of energy available, which has a direct impact on device performance, contributing or degrading its useful life. The proposed telemetry platform includes systems that allow to locally assess the quality of the distribution network, in addition to evaluating the pricing measures.
Moreover, processes control within the facility assumes special relevance in the control of electricity resources. The system provides automated monitoring and control of energy consumption, whereas the decision-making process of the facility’s administrator plays a relevant role in the effectiveness of this process.
Consumer habits should also be considered. Educational campaigns should be implemented to advise the space users to turn lights and air conditioners off in the absence of people. A simple measure is to place stickers close to the light switch reminding people to do so.
7. Future Studies
Using the same IoT infrastructure created for this study and sensors available in the market, the Administration envisions the installation of other types of sensors to perform new measurements such as the general consumption of electricity and water.
Electricity meters installed on switchboards could be certified by the concessionaire to streamline the billing process. Eliminating manual readings of local meters and electronically exchanging information may reduce costs for consumers and the utility. This feature can be implemented electronically using a Government to Business (G2B) e-government application.
The analysis of data collected from automated water consumption meters may provide support for actions to mitigate wasting this resource. The detection of abrupt consumption variance, over any period, can lead to immediate corrective actions such as interruption of water supply through automated valves, or signaling for repairs to the hydraulic network. The elaboration of consumption profiles of public buildings and places, especially those that rely on public water sources is yet another product of this type of project.
Acknowledgments
Federal funds supported this work through FCT—Fundação para a Ciência e Tecnologia within the Project Scope: UID/CEC/00319/2019. This work also had the collaboration of the company MODULUS ONE and the Secretariat of Management of Salvador City Hall (SEMGE).
References
ANEEL (2018). Procedimentos de Distribuição de Energia Elétrica no Sistema Elétrico Nacional—PRODIST. Agência Nacional de Energia Elétrica, Brasil. Retrieved September 23, 2019 from http://www.aneel.gov.br/documents/656827/14866914/Módulo_8-Revisão_10/2f7cb862-e9d7-3295-729a-b619ac6baab9
AWS (2019). Amazon Compute Service Level Agreement. Amazon Web Services. Retrieved September 24, 2019 from https://aws.amazon.com/compute/sla/
Almarabeh, T., Y. Kh. Majdalawi and H. Mohammad (2016). Cloud Computing of E-Government. Communications and Network 8(1), 1–8. DOI:https://doi.org/10.4236/cn.2016.81001
Bhati, A., M. Hansen and C. M. Chan (2017). Energy conservation through smart homes in a smart city: A lesson for Singapore households. Energy Policy 104, 230–239. DOI: https://doi.org/10.1016/j.enpol.2017.01.032
Chodorow, K. (2019). MongoDB: The Definitive Guide, second edition. Sebastopol, CA: O’Reilly.
Gil-Garcia, J. R., N. Helbigb and O. Adegboyega (2014). Being smart: Emerging technologies and innovation in the public sector. Government Information Quarterly 31, I1–I8. DOI:https://doi.org/10.1016/J.GIQ.2014.09.001
Khajenasiri, I., A. Estebsari, M. Verhelst and G. Gielen (2017). A Review on Internet of Things Solutions for Intelligent Energy Control in Buildings for Smart City Applications. Energy Procedia 111, 770–779. DOI:https://doi.org/10.1016/j.egypro.2017.03.239
Kleinbaum, D. G. and L. L. Kupper (1978). Applied Regression Analysis and Other Multivariate Methods. North Scituate, Massachusetts: Duxbury Press.
Kyriazis, S., T. Varvarigou, A. Rossi, D. White and J. Cooper (2013). Sustainable smart city IoT applications: Heat and electricity management & Eco-conscious cruise control for public transportation. 2013 IEEE 14th
International Symposium on , 1–5. DOI: https://doi.org/10.1109/WoWMoM.2013.6583500“ Omura, H. (2000). Information Technology (IT) for E-Government. FUJITSU Scientific & Technical Journal 36(2), 232–235.
Park, S. H., S. Cho and J. R. Lee (2014). Energy-efficient probabilistic routing algorithm for internet of things. Journal of Applied Mathematics 2014(1). DOI: https://doi.org/10.1155/2014/213106
Pokorny, J. (2013). NoSQL databases: A step to database scalability in web environment. nternational Journal of Web Information Systems
9(1), 69–82. DOI: https://doi.org/10.1108/17440081311316398Ramya, R. and K. Ramya (2015). Cloud computing. International Journal on Applications in Electrical and Electronics Engineering 1(8), 1–5.
Rooney, J. J. and L. N. Vanden Hauvel (2004). Root Cause Analysis For Beginners. American Society for Quality 7, 45–53. Retrieved September 2, 2019 from http://asq.org/quality-progress/2004/07/quality-tools/root-cause-analysis-for-beginners.pdf
Schuurman, D. and P. Tõnurist (2017). Innovation in the Public Sector: Exploring the Characteristics and Potential of Living Labs and Innovation Labs. Technology Innovation Management Review 7(10, 7–14. DOI:https://doi.org/10.22215/timreview/1045
Seifert, J. W. (2003). A Primer on E-Government: Sectors, Stages, Opportunities. CRS Report for Congress. The Library of Congress.
Vassileva, I. and J. Campillo (2016). Consumers’ perspective on full-scale adoption of smart meters: A case study in Västerås, Sweden. Resources 5 (1). DOI: https://doi.org/10.3390/resources5010003
Verzani, J. (2011). Getting Started with RStudio. Sebastopol, CA: O’Reilly.
Wang, X. and A. O. Lim (2008). IEEE 802.11s wireless mesh networks: Framework and challenges. Ad Hoc Networks 6(6), 970–984. DOI: https://doi.org/10.1016/j.adhoc.2007.09.003
Zheng, J., D. W. Gao and L. Lin (2013). Smart Meters in Smart Grid: An Overview. 2013 IEEE Green Technologies Conference (GreenTech), 57–64. DOI:https://doi.org/10.1109/GreenTech.2013.17